
|
|
|
|
Главная --> Промиздат --> Map principle An application for improved edge detection with vectorization based on segmentation is explained for aerial photographs in Section 10.4. 9.7. IMAGE FUSION Often, satellite data sets with high radiometric resolution (multispectral channels) lack a high geometric resolution and vice versa. However, for an accurate image interpretation, both radiometric and geometric resolution should be high. Image fusion is a method to geometrically enhance images with high radiometric resolution by merging the multispectral channels with a panchromatic image. Different image fusion methods have been developed; two basic methods will be described in the following sections. 9.7.1 Introduction to RGB and IHS color model To understand image fusion methods operating in color space, it is important to have basic knowledge about the RGB (red, green, blue) and IHS (also referred to as HIS or HSI: intensity, hue, saturation) color spaces. Similarly to geometrical data the color spaces span their own coordinate systems. Due to their definitions, it is possible to convert images lossless from one color model to the other. The RGB model is an additive color model, where new colors are derived by adding the three base colors at different levels. For example: yel- 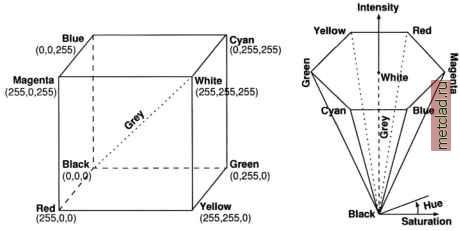 Figure 9.12. Left: RGB (red, green, blue) cubic color space; right: IHS (intensity, hue, saturation) hexcone color space (adapted from Mather, 1999:99) low = red + green. The IHS model is different; here, the intensity (sometimes also called value ) is a measure of color brightness, the hue corresponds with the dominant wavelength (which is related to color names), and the saturation describes degree of color purity. Figure 9.12 shows both the RGB and the IHS color model. A pixel in the RGB color space has a specific position within the cube spanned by the coordinate axes, while the IHS color space forms a hexcone. The main advantage of RGB is that it is easy to understand; however, intensity changes are dependent on color settings. Thus, in the RGB model, a change in intensity always leads to a change in colors. The IHS color model preserves colors in case of intensity changes which is a major advantage of this model. Based on this feature, the IHS model can be used to for image fusion, which we explain below. GRASS provides two color conversion modules, the i.rgb.his to convert an image from RGB to IHS and i.his.rgb to convert back from IHS to RGB. 9.7.2 RGB color composites Before starting with image fusion in terms of improving the geometrical resolution, we explain the standard color composites. Here three (each grey colored) channels are assigned to the colors red, green and blue; the result is a pixel-wise combined new image with a color table based on the input values as described in Section 9.3. 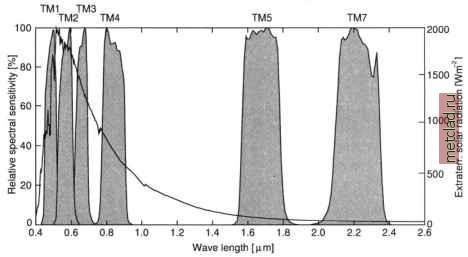 Figure 9.13. Exo-atmospheric solar radiation (in W/m2 on top of atmosphere, see right axis) and relative spectral sensitivity of LANDSAT-TM5 channel filter functions, thermal channel 6 is not shown (curves as defined in 6S source code, Vermote et al., 1997) When generating color composites from multispectral data, we need to determine which channels contain most information. For example, when considering LANDSAT-TM5 data, the following problem arises. Figure 9.13 shows the solar spectrum and the filter functions of LANDSAT-TM5. The color filter functions of channels 1, 2, and 3 partly overlap which leads to slightly correlated channels. Generally, 20 color composites can be produced from the six reflective LANDSAT-TM5 channels (not using the emissive thermal channel). Due to the slight correlations, the information contents is reduced when the first channels are combined. A simple method to find out the combinations with the highest information content is the Optimum Index Factor method (Chavez et al., 1984), which is based on a correlation analysis. It is implemented in the i.oif script. It calculates a rank of all reflective LANDSAT-TM5/7 band combinations and outputs a sorted combination table. Color composites can be generated with r.composite or i.composite. The latter requires all channels selected in an image group with at least three channels created using i.group. Within the menu of i.composite, the selected channels will be assigned to the colors red, green and blue by specifying the letters r, g and b. For example, to generate a near-natural color image, the satellite channels covering the red, green, and blue spectrum have to be assigned to r, g and b respectively. The number of color levels then has to be defined (the number of colors = specified levels3): e.g., 10 color levels will lead to 1000 colors in the composite image. Due to speed limitations in the current GRASS display color model for large color tables, we recommend not generating 24 bit image composites inside GRASS (use r.out.ppmS to export into a 24 bit PPM image). Finally, the output name for the composite has to be specified. After some computation time, the color composite raster image can be visualized in the GRASS monitor. Alternatively, the module r.composite, which also operates on command line, can be used. 9.7.3 Image fusion with IHS transformation For image fusion, two geometrically co-registered data sets are required. The acquisition time of these data sets should be very close to avoid possible modification of the result by land use changes. For IHS-fusion, the three RGB channels must first be transformed to the IHS color model. The general idea of IHS-fusion is to replace the intensity channel with a high resolution panchromatic channel for the back-transformation from the IHS to RGB color model. As a results, the color information in lower resolution is merged with the high spatial resolution of the panchromatic channel. In terms of GIS, a resolution change is required before back-transforming the images to achieve the higher spatial resolution in the output. A disadvantage of this fusion method is that this technique changes the spectral characteristics of the data.
|