
|
|
|
|
Главная --> Промиздат --> Map principle Chapter 9 SATELLITE IMAGE PROCESSING Remote sensing, as a rapidly advancing technology for gathering environmental data using a wide range of satellite platforms, plays a major role in spatio-temporal earth surface monitoring. Throughout this chapter we introduce the basic remote sensing methods and explain their use in GRASS. The tools for image processing and remote sensing applications will be illustrated using a SPOT-1 HRV (Haute Resolution Visible) and PAN (Panchromatic) image data set as well as a LANDSAT-TM7 scene available as an extension for the Spearfish data set. 9.1. REMOTE SENSING BASICS Before describing numerous methods implemented in GRASS in detail, we will explain basic concepts of satellite remote sensing. As this relatively short section cannot replace related textbooks, references will be given where appropriate. 9.1.1 Spectrum and remote sensing In principle, there are two different remote sensing approaches: the optical (passive) and the microwave (active) systems. Optical remote sensing is based on the measurements of radiation reflected from surfaces. It usually covers the visible (VIS) and infrared (IR) range of the spectrum. The reflected radiation in near (NIR) and middle infrared (MIR) spectrum behaves similarly to visible light, while thermal radiation (TIR) is surface emitted radiation. Longer wavelengths are in far infrared (FIR) range and in the important microwave range. See Figure 9.1 for a portion of the specttum. The optical region spans at wavelengths from 0.3-15 лп where energy can be collected through lenses. A subdivision of this optical region is the reflective region, ОЛ-Ъ.О /ит (Figure 9.1). The adjacent subdivision of the optical spectral region is the thermal spectral range which is between 3-15 /лп, where energy is primarily emitted from surfaces rather than reflected. Far infrared ranges from mi- crowaves from 1mm-1m. As opposed to optical systems, radar systems actively emit microwaves and measure the backscattered energy. The major advantage of radar is the relative independence from weather and solar illumination effects. In case of an overcast sky, the earth surface is hidden by clouds for optical satellites. However, radar satellites can continue to deliver usable images since microwaves pass through the cloud cover (this is of special interest in the tropics). Radar analysis is not covered in this book because it is fairly complex. For details please refer to the three microwave volumes by Ulaby, Moore and Fung, I98I, 1982 & I985, the book by Oliver and Quegan, I998, or other literature. Additional tutorials are available on the World Wide Web.1 Besides tools for optical data, GRASS also provides basic capabilities to process radar and thermal data. In this chapter we focus on images acquired by optical systems because they are widely used and their interpretation as well as data processing is easier than for radar data. Reflected radiation and atmospheric effects. Optical remote sensing systems are measuring sun energy reflected from earths surface. While the sun is emitting a full range spectrum with a special energy distribution, only part of the energy reaches the earths surface. The reason are various absorption and scattering processes within the atmosphere. Figure 9.I outlines the solar radiation on top of atmosphere and at earths surface. Before reflected solar energy reaches a sensor, it has passed the atmosphere twice at different angles. Correction of such atmospheric effects often requires image preprocessing. It is important to know that for some ranges of the spectrum, radiation cannot pass the atmosphere at all. Within these absorbed wavelengths optical remote sensing platforms are unable to receive reflected radiation from earth. Therefore, the spectral filters of satellite sensors are defined accordingly. Schowengerdt, I997, describes these issues at a greater detail. Remote sensing of the environment considers the sun energys reflection in the visible and infrared range of the spectrum. Depending on the material of the observed object, the amount of reflected radiation varies. The reflectance curves of three basic materials are shown in Figure 9.2. While water absorbs most radiation in the visible spectrum and all in near-infrared, the radiation reflection of unvegetated sandy soil increases from the visible spectrum to the infrared range. The curve for green vegetation is highly dependent on the contents of chlorophyll. With a small peak for green wavelengths, the overall amount of reflection in the visible spectrum is much lower than for the infrared, 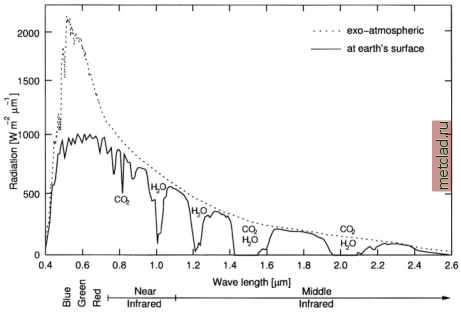 Figure 9.1. Distribution of solar radiation (reflective portion of the spectrum) on upper boundary of atmosphere and at earths surface with gaseous absorption (solar zenith angle 45°, curves as defined in 6S source code, Vermote et al., 1997) especially in the near-infrared. The curve depressions at higher wavelength depend on the water contents of the plant. In case of a plant disease or dormant stage the reflection in infrared is dramatically decreased. The different reflectance curves allow us to distinguish the observed objects by multispec-tral remote sensing. For more theoretical details please refer to Richards and Xiuping, 1999. 9.1.2 Satellite sensors The payload of the satellite platforms are usually multispectral systems with a narrow spectral range. Some systems are extended by one panchromatic channel which covers a large wavelength range, usually at a higher resolution than the multispectral channels. Figure 9.2 shows the spectral coverage of the LANDSAT-TM5 channels. While the satellite is overpassing the earths surface, the reflectance radiation is measured line-wise. All satellite sensors are collecting data at the same time, delivering a set of images where every image contains the reflection as it appeared in the related spectral range. Such a data set of geographically related images is called image scene. These mul-tispectral satellite data are analyzed statistically as described in this chapter.
|