
|
|
|
|
Главная --> Промиздат --> Map principle text file can be used later to apply modifications and to use ps.map as a script. Unfortunately, the module still lacks a convenient graphical user interface. Before starting to produce a map, a printer device defining the paper size has to be selected. As an example we select an ISO-A4 device (before that we list the available devices): ps.select -1 ps.select a4 Then you can start ps.map The module will guide you through text menus and allow to customize the map. You may try it with the Spearfish data set and select a raster, a vector and a sites map. Define an appropriate map scale. The module will then ask if you want to save the instructions, we recommend doing that. You can edit this text file later, in case that you would like to make changes and use it in the command line mode of ps.map. A sample text file psmap.def for a soils map in Spearfish may look like this: 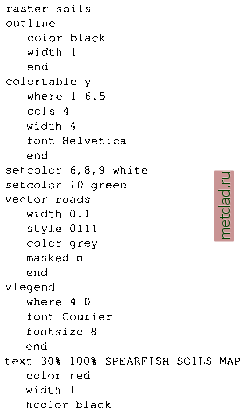 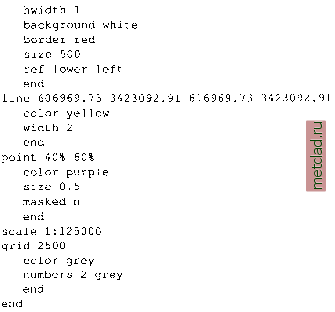 The module is run on command line with these map definitions to produce a Postscript map file: ps.map input=psmap.def output=soils.ps The module generates the Postscript map which may require some time depending on the input map size, the map scale and the selected paper size. Please refer to the manual page to learn more about this module. After the map is generated, you may preview it with a Postscript interpreter such as ghostscript (a convenient graphical user interface for ghostscript is gv). If the map is as desired, you can send it to the printer: Ipr -s -Pprinter mapname.ps The optional flag -s avoids generating another temporal copy of the file in the printer queue. Enter the correct printer name for printer (note that there must be no space between -P and the printer name). 8.3.2 Map design with Xfig and Skencil Maps based on GRASS data can be also designed with xfig, a general purpose Open Source drawing program with raster and vector support. It is freely available at the Xfig web site.8 The program can be run interactively and provides full graphical user interface. It reads several raster formats such as TIFF or PNG and supports scale for drawing lines. NOTES 1 GRASS 5.3 online user manual, http: grass.itc.it/gdp/html grass5/ 2 PNG library, http : www. libpng. org/pub/png/ 3 Nviz tutorial, http: grass .itc. it/gdp/online.html 4 GRASS Tutorials Web site, http: mpa.itc.it/grasstutor/ 5 MPEG encode software, ftp: mm-ftp.cs.berkeley.edu/pub/multimedia/ mpeg/encode/ 6 Spatial modeling and visualization, http: skagit.meas.ncsu.edu/~helena/gmslab/ 7 Vis5D software, http: www.ssec.wisc.edu/~billh/vis5d.html 8 Xfig drawing software, http: www .xfig.org 9 Skencil drawing software, http: skencil. org/ To import a raster map, export it from GRASS into a xfig accepted format such as TIFF or PNG. In xfig the Picture icon is used to import and place a raster image within the workspace. For high-resolution raster maps, the PNG driver is recommended (see Section 8.1.3). GRASS vector data can be exported to FIG format with v.out.xfig. The resulting file is directly accepted. GRASS sites data may be converted to GRASS vector sites with s.to.vect, then exported with v.out.xfig. An alternate method is to generate a map with ps.map and to convert it to FIG format with pstoedit. Read xfig documentation to learn more about the use of this tool. An alternative drawing program to Xfig is Skencil.9 It is Free Software and supports a range of common vector formats including formats known from the MS-Windows world. The look and feel is different from Xfig. A useful option is support for Scalable Vector Graphics (SVG), and the ESRI SHAPE format which requires the GeoObjects add-on. This add-on package is also available from the Skencil web site. GRASS vector maps can be imported in two ways: Either through FIG format using v.out.xfig (for details see above) or through SHAPE format using v.out.shape (for details on how to export SHAPE data see Section 4.2.3). Vector data will be immediately displayed after loading. Raster data are loaded through the toolbar; on the very right, you will find the Load raster/EPS icon. Legends, scales and map frames can be drawn by mouse, using the tools provided by Skencil.
|