
|
|
|
|
Главная --> Промиздат --> Map principle PIXEL HALF PATTERN IBBPBBI IQSCALE 8 PQSCALE 10 BQSCALE 25 RANGE 10 SLICES PER FRAME 1 REFERENCEFRAME ORIGINAL The parameters can be set based on the documentation for mpegencode. Of interest are the lines OUTPUT (the name of the resulting movie) and the line between INPUT and END INPUT (how single frames are located and named). Encoding is performed by running mpegencode mpegparam.txt The result may be viewed with MPEG players like mplayer or gtv. The resulting image size can be controlled using the nviz window size or MPEG parameters in mpegparam.txt . The latter reduces image quality by smoothing while the former is more expensive with regard to CPU and time. Creating animations using scripting. Complex animations involving multiple surfaces, vector and site data, cutting planes, changing views and light parameters can be created using the scripting capabilities of nviz. Animations using dynamic map layers can be used, for example, to view and analyze (Mitas et al., 1997): results of dynamic simulations such as water, sediment, pollutant transport, fire spread, migration of animals, traffic, and urban growth; time series of observed data from monitoring and remote sensing, such as movement of pollutants, change in rainfall or temperature, past urban growth or vegetation change; behavior of a method or algorithm, for example, by animating the results of parameter scans (impact of tension parameter on an interpolated surface, or impact of land cover factor on erosion and deposition pattern, etc.). You can create scripts for creating animations by using the basic scripting. While the scripting is turned on, the performed visualization tasks are saved in a script file, so that they can be repeated as desired. Dynamic surfaces can be created using the file sequence tool available under Scripting Script Tools . The use of these tools is rather complex, however, it is well described using the step-by-step example in the Nviz tutorial. Many examples of animations created by scripting can be found on the Spatial modeling and visualization web site.6 8.2.4 Visualizing volumes Volume data can be visualized in nviz using 3D sites and multiple surfaces. Isosurfaces and crossections are being added at the time of this writing, see Figure 8.9. Please refer to the GRASS web site and nviz tutorial for the latest update. There are numerous examples of prototype volume and volume-temporal visualizations developed for GRASS using the tools based on SGI GL library at Spatial modeling and visualization web site (see Endnotes of this chapter). GRASS also supports export of volume data in external formats used in other visualization programs, such as vis5d (Hibbard et al., 1994). Coupling with an external OpenGL viewer VisSD. After exporting with r3.out.v5dGRASS volumes can be displayed in vis5d7 visualization software. This tool offers various methods to render rotatable semi-transparent volumes, isosurfaces, movable cutting planes and isolines. The code is based on OpenGL which will, such as nviz, use hardware acceleration for volume display if a video card capable of hardware OpenGL is used. The software also supports the 3D queries of volumetric data. Figure 8.10 shows an isosurface view of a interpolated volume representing soils pH values. The same volume seen in Figure 8.10 can also be displayed semi-transparent. Refer to the documentation for Vis5D for more details on how to visualize volume data using this tool. 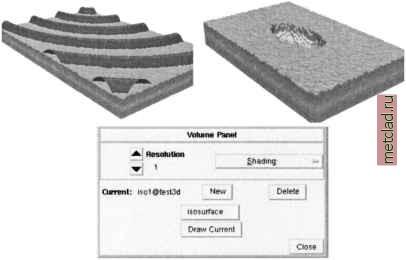 Figure 8.9. Volume (3D grid) visualization integrated in nviz: test volumes and a new panel (development and image by Tomas Paudits) 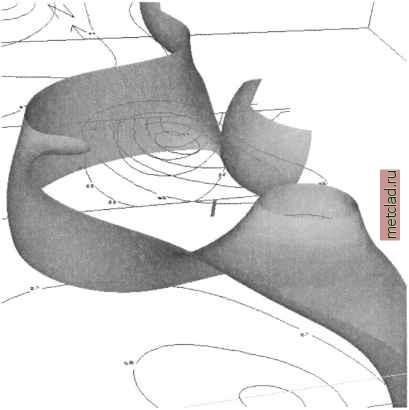 Figure 8.10. 3D pH values displayed in Vis5D visualization tool: isosurfaces and isolines view (Neteler, 2001b) 8.3. CREATING HARDCOPY MAPS The tools for creating hardcopy maps in GRASS are relatively limited because of its focus on modeling and spatial analysis rather than computer cartography. The hardcopy maps can be created by a text-oriented Postscript graphics tool or in combination with other Open Source graphics programs. 8.3.1 Map generation with ps.map Hardcopy maps can be created by printing Postscript graphics generated by ps.map. The Postscript graphics may be produced interactively or scripted. All raster, vector, and site data are supported, as well as (numbered) grids, user defined icons and a bar scale. It is useful to run ps.map interactively when using it for the first time. After questions for providing the names of the map layers and additional map features, the program asks about saving the instructions to a file. This saved
|