
|
|
|
|
Главная --> Промиздат --> Map principle Provide the following information: Your organization GRASS Development Team Todays date (mon, yr) 8/23/90 grass Your name Maps name Maps date Maps scale Other info Zone West edge of area South edge of area East edge of area Output from v.patch 1:24000 587433.541 4912505.24 611556.409 North edge of area 4929524.12 After completing this dialog, you will be transferred to the main menu of v.digit. The menus of v.digit are used as follows: To reach submenus from the main menu, enter the first (capitalized) letter of the menu name. A submenu is left with q. Other entries within the submenus are selected by entering the related key: 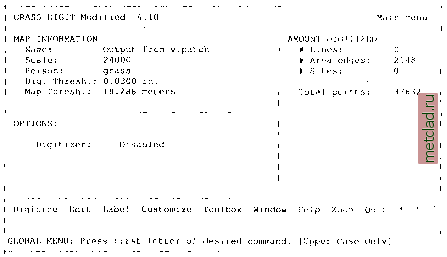 First, we want to display the scanned topographic map in the GRASS monitor to use it as digitizing reference. For this choose the option Select A Backdrop CELL Map (B) from the Customize submenu (C). You can list the available raster maps by entering list. After selecting the raster map, it will be shown in the background. It is also possible to display a vector map. For this, choose Select An Overlay Vector Map (O). Leave the Customize submenu with q to reach the main menu. We are now ready to start the digitizing procedure. Note that v.digit provides a context help system which shows the meaning of each menu entry (use H to reach it). Digitizing vector sites, lines and areas. The digitizing is started by opening the Digitizing menu by pressing D. It is important to choose the appropriate object type (site, line or area) by pressing t ( toggle type ). If desired, switch on the auto labeling function. When activated, the category number and optionally also the category label are automatically assigned to the vectors. GRASS will query for both values. An alternate method to enter/modify these labels is using v.support (menu entry Edit the category file in interactive mode, find details in Section 6.2.2). 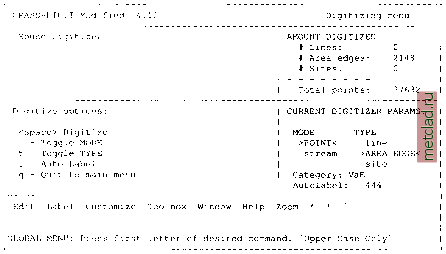 The digitizing process itself is started with <SPACE>. Now switch over to the GRASS monitor, and start to draw lines using the mouse by clicking on the points representing the line with the left mouse button. The mouse menu is shown in the terminal window, the buttons provide different functions such as drawing nodes and lines, removing the latest drawn node and finishing/omitting a line. This requires a bit of experience but you will quickly feel familiar with the concept. This way you can digitize line by line (or just vector sites) while getting the vector features automatically labeled by using the auto-label function. Labeled lines have a different color than the unlabeled lines. The labeling status can be checked in the submenu Toolbox (T), the labels themselves are displayed from the submenu Window (W). Generally, we recommend making an extensive use of the zoom function which can improve the digitizing accuracy significantly. The function is available everywhere, while digitizing as well as with key Z from the main menu. The pan (panning, select while digitizing from the mouse buttons menu) 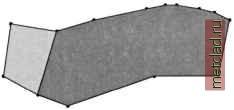 Figure 6.1. Digitizing common area boundaries in a topological GIS function allows us to move the map into any direction without changing the zoom level. When intersecting lines or connecting to lines, a node has to be inserted at the intersection. This is done by breaking the existing line which you want to cross or connect to. To break a line, enter the Edit menu (E) and select b ( Break a line ). Then you have to select the line to be broken and insert a node. You can now snap lines to this node which is explained next. In the same menu you also find functionality to move nodes, lines, to re-type a vector line (toggle between line and area type), to smooth a vector line with a spline, and to remove a block of lines. When working with polygons, it is important to digitize common boundaries of adjacent areas only as a single line (see Figure 6.1). GRASS will automatically assign the common boundary to both areas. Never digitize a common area edge as two parallel lines! To verify, the Toolbox menu provides the function Display Duplicate lines (d) which highlights duplicate lines. Snapping of nodes. Node snapping is necessary when digitizing a line which consists of several parts, or when closing a vector area. As mentioned above, closing areas is mandatory because only then is GRASS able to establish vector topology and assign label points. A great help is the built-in snapping function. When two nodes are close to each other (depending on the current snapping threshold), they will be moved into the same node and reduced to one node. When you receive a message that snapping cannot not be done, you have three options: you may either reject this area, zoom and vectorize again, or snap the open area in the Edit menu (E) using the snap (s) function. Such snapping problems are usually an indicator that you either have forgotten to change the map scale from 1:1 to the current map scale or, if it is correct, that you should zoom further on into the current map portion. To optimize the snapping function, you can adjust the snapping threshold in the Customize menu using the s ( Set snapping threshold ). The snapping threshold should be chosen appropriately for the map scale. The value has to be entered in inches, but it will be converted to metric units based on the
|