
|
|
|
|
Главная --> Промиздат --> Map principle 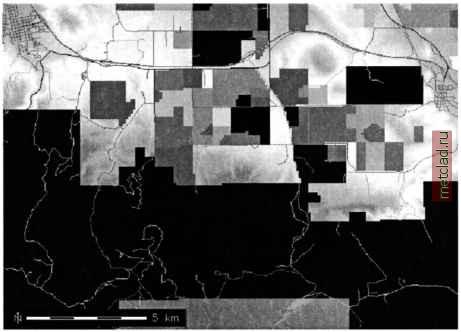 Figure 5.4. Map composite of roads, land use map and elevation model created with r.patch (Spearfish area) combining adjacent image raster maps with large number of colors is a slight problem, because the GRASS display color model significantly slows down when more than 8000 colors are used in a map. In case of 24 bit images, such as color aerial photos, the color channels R, G, B are usually kept separated. A workaround for patching high-color maps together without slowing down GRASS is the script i.image.mosaic. It merges the color tables of adjacent maps accordingly while patching the maps. For example, multiple adjacent digital elevation models can be imported and merged as follows: r.in.arc in=392619.asc out=392619.deml2 r.in.arc in=392620.asc out=392620.deml2 r.in.arc in=392626.asc out=392626.deml2 r.patch in=392619.deinl2, 392620.deml2, 392626.dernl2 out=deml2.5 To modify the color table to a suitable one for a DEM (from green over yellow to red), run: r.colors map=deml2.5 со1=дуг d.rast deml2.5 In another example, we will compose several maps within the same area. Except for the Spearfish map elevation.dem, all maps contain NULL values which are filled by the underlying map(s) (in case that they contain non-NULL values in these particular cells): r.patch in=roads,railroads,fields,elevation.dem out=map.comp d.rast map.comp Here, the roads network is on top, followed by the other maps. The DEM is filling all areas not being filled by other maps (see Figure 5.4). Map overlays can also be done with r.mapcalc. The r.mapcalc tutorial (Shapiro and Westervelt, 1992) describes several examples. Figure 5.5 shows the differences between a map merge using r.patch or r.mapcalc respectively. The module r.patch patches on a basis of overlays, while r.mapcalc combines the raster map layers base on a user defined expression, as described in the Section 5.2. For validation, the module r.cross checks the plausibility of merged maps against the input maps. Using the interactive mode of r.cross, you first have to enter the names of the source maps which have been merged earlier (at least two). When all source maps are specified, press <ENTER> one more 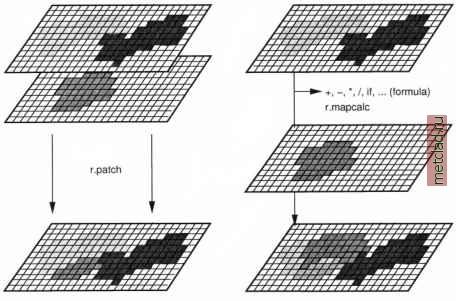 Figure 5.5. Raster data merging with r.patch (left) and r.mapcalc (right) time to finish the dialog mode. Now you have to specify a name for the output control map containing the resulting validation. This map can be displayed and checked using d.what.rast to see whether the results are equivalent to the source data or not. In case that you want to display only the table with category labels (attributes), use r.cats in conjunction with the r.cross output map. 5.4.3 Buffering of raster features A method to widen linear or area features in space is buffering. The implementation in the GRASS r.buffer module allows us to define one or several buffers with different spatial extents. As an example, we want to find out the noise distribution along the interstate for the Spearfish area. To illustrate the use of buffers we use a simplified model which does not take wind into account. We want to know which residential areas are influenced by different levels of noise. The result may determine whether noise protection walls have to be installed or not. The buffer zones may be 250 m (high disturbance), 500 m (moderate disturbance) and more than 500 m (low disturbance). First, we have to select the interstate and store it into a new map. This can be done, for example, with r.mapcalc (if-condition) or r.reclass. Here we use the latter command to demonstrate another way of entering the class values. First, we check the category value of the interstate with r.report, and then we create the raster map interstate: 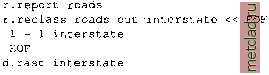 We can now apply the buffer zones: 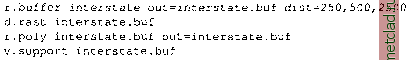 We have selected the last buffer to be 2,500 meters in order to reach quasi infinity (of course, thats highly dependent of the wind direction). Finally, we have to intersect the buffered interstate map with the landuse map which contains the residential areas: r.report landuse r.mapcalc noise=if(landuse==l, interstate.buf, nullO) Using some additional commands, we can look at the noise map. The numbers as drawn by d.rast.labels represent the categories 2 (0 m to 250 m),
|