
|
|
|
|
Главная --> Промиздат --> Map principle 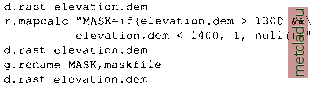 You will see that the second display command only shows the selected elevations. All raster map operations performed after setting MASK are performed only in the non-masked areas. After MASK is renamed, the entire elevation map is displayed again. Evaluation of internal temporary variables. To perform multiple steps within one expression, we can use the function eval (). It evaluates temporary variables without the need to store them in a raster map. The intermediate steps are written within the eval () function, delimited by comma and the last result is saved as a raster map. As a simple example, we will round a floating point map mapl, store the result for each cell in a temporary variable a , and subsequently perform a decision based on a condition (if rounded cell value of map==3, then keep 3, otherwise set NULL): Using r.mapcalc on command line. In order to have cursor key support when writing expressions, use r.mapcalc on the command line. Remember that the expression must be quoted in this case. To illustrate the usage we will generate a map mosaic using the following rules. If the coordinates in x and y direction are smaller than the given values, then store the values from a map aspect in the resulting newmap, otherwise store the values from elevation.dem: r.mapcalc newmap = if((x ()<599490 && у ()<4920855) ,\ aspect,elevation.dem) d.rast newmap In the above example the variable containing the current coordinates of the moving windows was used. Note that color values of the original maps are not transferred. Creating MASK with r.mapcalc. A convenient, non-interactive way to create MASK is to use r.mapcalc. As an example, we will create MASK that will allow us to perform operations only in areas with a given range of elevations. We define an expression which assigns the value 1 to the cells that have elevations between 1300 m and 1400 m in the given elevation.dem map and NULLs will be assigned elsewhere. In the following sequence of commands, we will display the elevation map (you need to have a monitor open), build the MASK map, display the elevation map again to see the difference, rename MASK to another name to disable it, and display again: 5.3. RASTER DATA TRANSFORMATION AND INTERPOLATION GRASS provides capabilities for transformation of raster data to vector and site data model using various approaches, depending on the type of raster data and application. In this section, we also explain how to interpolate raster data. 5.3.1 Automated vectorization of discrete raster data If the raster data represent linear features or homogeneous areas these features can be transformed to vector data representation. Two modules are available: r.line transforms raster line features to vector lines, while r.poly transforms raster areas to vector polygons (see Figure 5.2). Vectorizing lines. It is often necessary to thin (skeletonize) raster lines to a single pixel width using the module r. thin before they can be transformed to vector data. The lines are then vectorized using r.line. For example, to vectorize the raster map streams, we run: r.mapcalc newmap=eval( a = round(map), if(a==3,3,null ()) ) Note that in this simple example the result can be also calculated directly as: r.mapcalc newmap=if( round(map)==3,3,null () ) In another example we select a range subset from a floating point map, while the NULL values will be kept. This shows a more complex expression using the variables tl and t2 for temporary results (if a<=map<=b then c else d while leaving NULL cells unchanged): newmap = eval (tl=round(map), t2=if(((tl >= a) && (tl <= b))\ ,c,d), if(isnull(map), map, t2)) Remember that when using the backslash (\) blank must not follow this character. A useful alternative for value replacement is the module r.recode (see Section 5.3.5). For complex value replacements this may be more convenient than writing lengthy if statements in r.mapcalc. As a final example of an application with internal variables we can generate a tilted plane, dipping to the northwest with starting altitude 100 m (we have to specify 98 m, as row and column each start with 1): newmap = 98 + row() + col() Many interesting examples of r.mapcalc applications for GRASS4.* can be found in Shapiro and Westervelt, 1992. 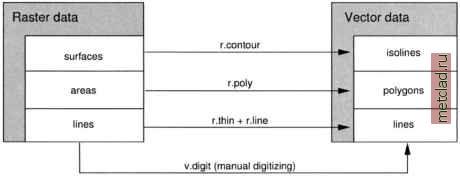 Figure 5.2. Modules for transformation of different types of raster data to vector representation 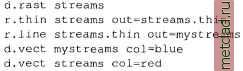 Note that the streams vector map is already available; you may use it for a comparison. Due to the low resolution of the streams raster map, the resulting lines have a geometry that follows the original grid pattern, but in spite of this deficiency, the stream network should fit well with the original streams vector map displayed in red color. You may try to do the same later with a stream map derived from a higher resolution elevation model. Vectorizing raster polygons. A different method is needed for vectorization of raster polygons. Such polygons may be generated by reclassification of a raster map (see Section 5.1.5). Using the area borders, we can convert the raster polygons to vector areas. Note that vectorizing of areas does not require thinning. It can be done directly with r.poly. As an example, we vectorize the map elevation.zones which we created above: 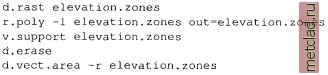 The r.poly flag -l smoothes corners when generating vector lines. The command v.support is required to build the topology of the vector file. We will explain this in more detail in the next chapter. The command d.vect.area with flag -r can be used to display color-filled vector polygons.
|